Quick answer: ATMOSIScience publishes two carbon comparisons against traditional desiccant, and they differ because they use different functional units. Compared by unit mass, the reduction is 31.25%. Compared on a same-drying-effect basis, it is 293.75%. The gap exists because a desiccant is not bought by the kilogram — it is bought to remove a quantity of water, and fiber desiccant does that with roughly a fifth of the mass. Neither number is the “real” one. Which one applies to you depends on whether you are substituting mass for mass or performance for performance — and any public claim must state which.
A sustainability manager, a packaging buyer and a marketing lead look at the same slide and take away three different numbers. It happens with almost every carbon comparison in packaging, and it is not because anyone is being careless. It is because a percentage reduction is a ratio, and nobody agreed on the denominator.
Two numbers, one comparison
| Basis of comparison | Reported reduction vs. traditional desiccant |
|---|---|
| Compared by unit mass | 31.25% lower |
| Compared by same drying effect | 293.75% lower |
ATMOSIScience carbon footprint data analysis, fiber desiccant vs. traditional desiccant.
Both describe the same two materials. The first divides emissions by kilograms of desiccant. The second divides them by the job the desiccant does.
What a functional unit is
In life-cycle assessment, the functional unit is the quantified performance you are comparing against. It is chosen first, before any data is gathered, and everything is normalised to it.
The choice is not cosmetic. Compare two lightbulbs per kilogram of bulb and you get a nonsense answer; compare them per million lumen-hours delivered and you get a useful one. Compare two insulation materials per cubic metre and you get one ranking; per unit of thermal resistance, another.
Desiccant is the same class of problem. Nobody buys a desiccant to own a desiccant. They buy it to hold a headspace below a humidity for a period of time. That is the function, and it is what the second row of the table normalises to.
Why per-kilogram is the wrong basis here
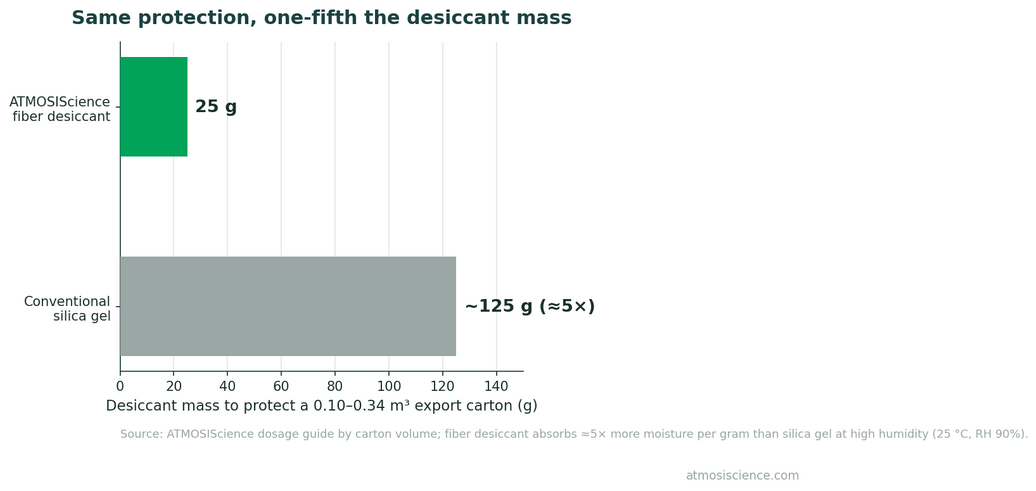
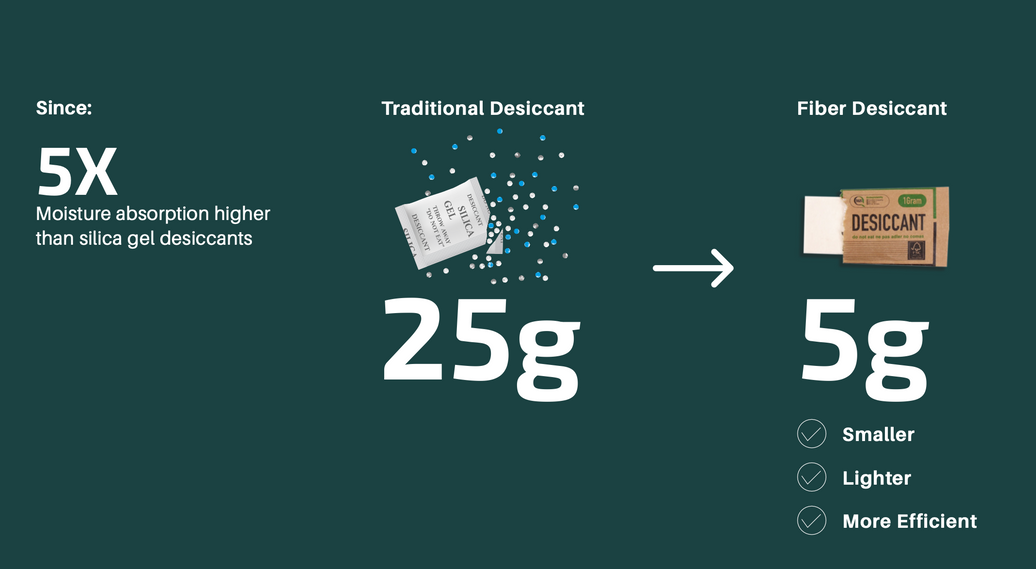
Because the masses are not comparable in service. Fiber desiccant is quoted at roughly five times the moisture absorption of silica gel, which shows up as a straight substitution ratio in the product range:
| Fiber desiccant | Equivalent silica gel |
|---|---|
| 1 g | 3–5 g |
| 5 g | 15–20 g |
| 9 g | 30–40 g |
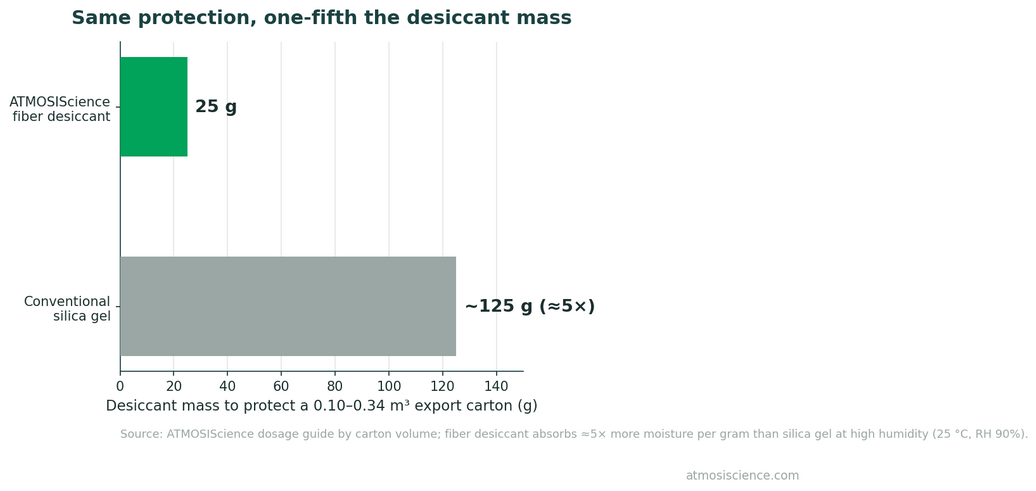
| 5 g | 25 g — the headline substitution |
The underlying capacity data is starker still. Per kilogram of desiccant at RH 90% and 25 °C, silica gel takes up about 300 ml of water; the patented fiber takes up about 1,500 ml. Raise the condition to RH 95% and 45 °C and silica gel stays at roughly 300 ml while the fiber rises to about 2,400 ml — a material that responds to temperature versus one that essentially does not.
So if you swap kilogram for kilogram, you have not swapped like for like. You have installed several times the moisture protection you needed, or you compared two products doing different amounts of work. The substitution arithmetic is worked through in silica gel equivalency and how to cut desiccant mass by up to 80%.
Where the mass difference actually turns into emissions
It is worth being concrete about why mass matters so much, because “lighter is greener” is exactly the kind of hand-wave that gets a claim challenged.
Production. Fewer grams of material produced per pack protected. This is the part the per-kilogram figure captures.
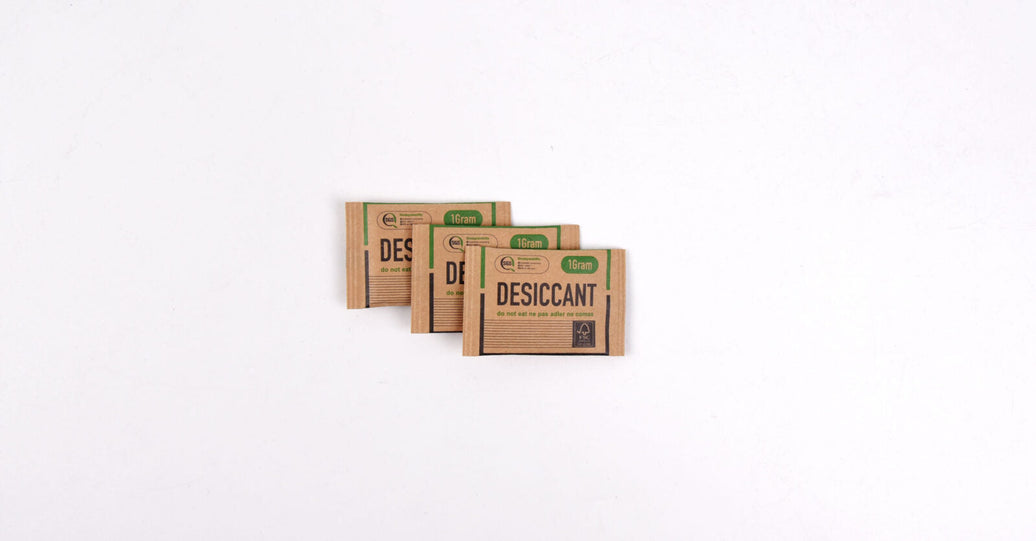
Freight. This is the part it does not. Desiccant ships as dense freight in cases — 8,000 one-gram sachets to a 12 kg case, 2,000 five-gram sachets to a 12 kg case, 1,500 nine-gram sachets to an 18 kg case, all in a 47 × 34 × 32.5 cm carton. Replacing 25 g of silica with 5 g of fiber does not shave a fifth off the desiccant freight; it changes how many packs one case protects. The freight and disposal arithmetic is set out in the true cost of silica gel.
End of life. Less mass entering the waste stream, and a different stream entirely for a fibre-based product — which is where recyclability data and EPR fee modulation come in.
What each number licenses you to say
This is the part that matters if anything you write ends up in front of a regulator, a retailer’s sustainability team or a competitor.
The per-mass figure answers: is this material less carbon-intensive to make, kilo for kilo? Use it when comparing material footprints on a common basis — for example, in a supplier scorecard that normalises everything per kilogram.
The same-drying-effect figure answers: if I switch, what happens to the footprint of protecting one pack? Use it in a switching business case, where the alternative is a specific mass of a specific incumbent product.
What neither licenses is a bare percentage with no basis attached. “294% lower carbon” on a website, with no functional unit, no system boundary and no named baseline, is the shape of claim that European green-claims rules are specifically designed to catch. The fix costs one clause: compared on a same-drying-effect basis against [baseline], per [study], boundary [stated].
Three things to request before you use either number
- The functional unit, in writing. Per kilogram of desiccant? Per gram of water adsorbed? Per pack protected over a stated shelf life? These give different answers and all three are legitimate.
- The system boundary. Cradle-to-gate stops at the factory door. Cradle-to-grave includes freight and disposal, which is where a mass difference does much of its work. Comparing a cradle-to-gate figure against a cradle-to-grave one is the single most common error in packaging carbon comparisons.
- The baseline product. “Traditional desiccant” covers silica gel, bentonite clay and calcium chloride, and they do not share a footprint. Ask which one, at what grade, in what format — the material differences are in desiccant capacity compared.
ATMOSIScience has published a fiber carbon footprint report, and the absolute figure and its standard are covered in fiber desiccant carbon footprint: ISO 14067-verified. Absolute numbers with a stated standard behind them travel much better than percentages; if you are building a claim, start there.
Where this lands in your own reporting
For most brands the desiccant sits in purchased goods and services, which means it is a Scope 3 line. Two practical notes.
If your inventory is spend-based, a switch to a lighter, more effective desiccant may barely register — spend-based methods are largely blind to material substitution. Moving that line to an activity-based calculation is what makes the reduction visible, and it is worth doing before you promise anyone a number.
And the regulatory direction is aligned with the same-drying-effect view. PPWR sets packaging-waste prevention targets against a 2018 baseline — 5% per capita by 2030, 10% by 2035, 15% by 2040 — measured in mass. A component that delivers the same protection at a fifth of the mass reduces the tonnage as well as the carbon, which is the subject of PPWR Article 10 and Article 43.
Frequently asked questions
How can a reduction be more than 100%?
Because it is expressed as a ratio of difference to the lower figure rather than as a share of the higher one. A percentage above 100 always signals that the denominator is not what a casual reader assumes, which is precisely why the basis has to be quoted alongside the number.
Which figure should go in a customer questionnaire?
Whichever matches the question. If it asks for emissions per kilogram of packaging material, use the per-mass basis. If it asks about the impact of a switch, use the same-drying-effect basis and state the incumbent product you are comparing against.
Does the 5× substitution hold at every humidity?
No, and this matters for the functional unit too. Ratios shift with temperature and RH, and each material has an RH band where it performs best — the data is in moisture capacity is not adsorption rate. Run your substitution at your own conditions before putting a ratio in a business case.
Should freight be inside the boundary?
If you are claiming a benefit that comes from carrying less mass, yes — otherwise the claim excludes the mechanism it depends on. Say what is in and what is out; a narrower boundary honestly stated beats a wider one vaguely implied.
What is the strongest single number to lead with?
Usually a mass figure, because it is verifiable by anyone with a scale: 25 g of silica replaced by 5 g of fiber, per pack, across a stated annual volume. Mass converts cleanly into freight, into EPR fees and into prevention-target tonnage, and no one can argue with the arithmetic.
Get the carbon data with its functional unit attached
Tell us what your reporting or your customer questionnaire actually asks for. We will send the figure on the right basis, with the boundary and baseline stated, so it survives review.
Prefer email? info@atmosiscience.com