Quick answer: Most desiccant dosage calculations start from a room humidity figure that was never measured — a design set-point, a wall gauge, or a number someone remembered. A mapping study replaces that guess with a distribution: how RH varies by location, by height, by shift and by season. Run at least one summer and one winter campaign, log at 15-minute intervals for a minimum of one full week per season, place sensors at product height rather than eye height, and report the 95th-percentile value rather than the mean. That percentile — not the average — is what the package has to survive.
Two facilities can both report "about 50% RH" and produce completely different packs. One runs 48–52% all year. The other averages 50% because it sits at 35% in February and 70% in August. The second facility will have a summer caking problem and will not understand why.
Why the average is the wrong number
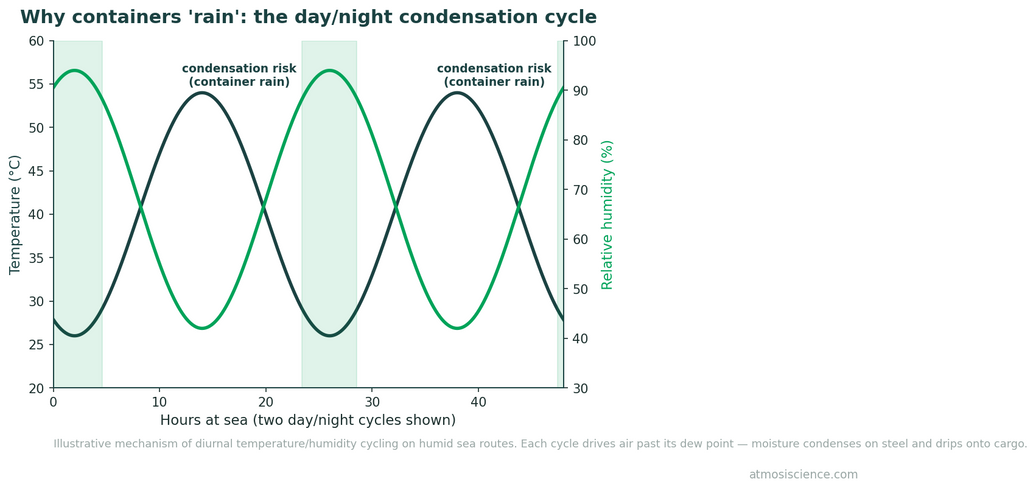
Moisture damage is not caused by average conditions. It is caused by the worst conditions the product met, and by the fact that whatever humidity is in the air at the moment of sealing is captured inside the pack permanently.
A pack sealed during an August afternoon carries August into the distribution chain for its entire shelf life. Averaging that against February does not help the August units. This is the mechanism behind seasonal complaint patterns described in how in-plant humidity taxes powder packing lines.

Scoping the study
Map the zones the product actually passes through, which is usually more than the fill room:
- Raw material store — where opened ingredient containers sit between uses.
- Dispensary or weigh room — short exposure but frequently the most humid space in the building.
- Blending and hold area — where intermediates wait, often the longest exposure of the whole process.
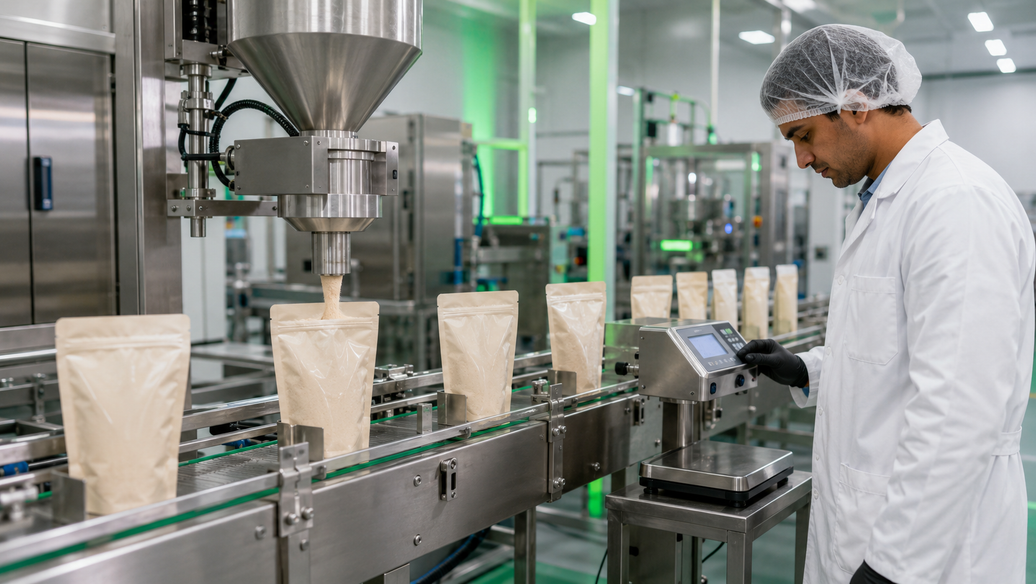
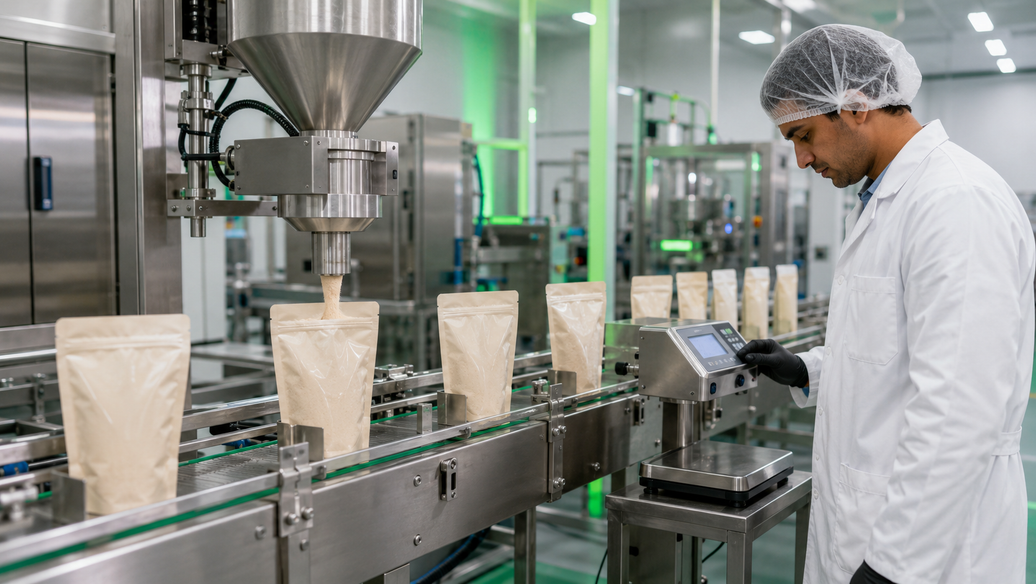
- Filling and sealing line — the critical measurement, since this is the moment of capture.
- Finished goods warehouse — sets the permeation driving force for weeks or months.
- Loading dock — the worst spot in most facilities and almost never instrumented.
Sensor count and placement
There is no universal number, but the logic is consistent: enough sensors to characterise the variation, placed where the product is.
- Cover the extremes deliberately. Near doors and dock levellers, under and away from HVAC supply diffusers, at the geometric centre, in corners with poor air movement, and adjacent to any process generating moisture or heat.
- Map vertically as well as horizontally. In high-bay warehouses, conditions at pallet position 5 differ from floor level. Racking heights matter.
- Product height, not eye height. A sensor on a wall at 1.6 m does not describe the air at the fill nozzle or inside a pallet stack.
- Include one outdoor reference. When indoor RH correlates with outdoor dew point, the building envelope is the finding.
Duration, interval and repeats
- Interval: 15 minutes or shorter. Hourly logging hides short excursions around door openings and shift changes — which are exactly the events that matter.
- Duration: a minimum of one continuous week per campaign, covering all shifts, including weekend shutdown when HVAC may be set back.
- Repeats: at least summer and winter. Two campaigns in the same season produce a confident answer to the wrong question.
- Calibrate before and after. An uncalibrated logger drifting three points invalidates the study.
Reading the output
Report four things per zone:
- Mean RH — useful context, not a design input.
- 95th-percentile RH — the design input.
- Maximum RH and its duration — excursion characterisation.
- Spatial spread — the gap between the wettest and driest sensor at the same moment. A wide spread means the room is not really controlled, whatever the wall gauge says.
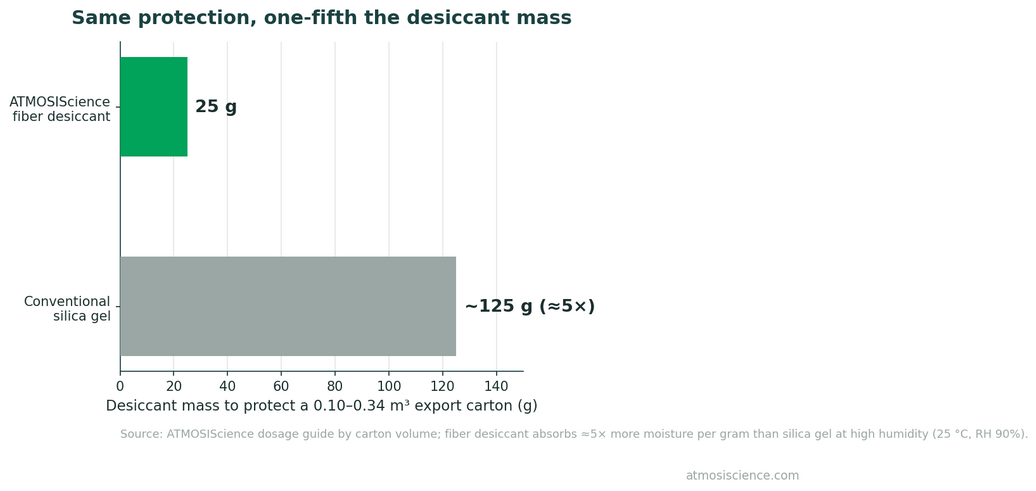
Then feed it forward. The 95th-percentile fill-room value sets the sealed-in-air term. The warehouse value sets the permeation driving force. Together with package WVTR they produce a dosage — method in desiccant dosage by MVTR and dosage by carton volume.
What to do with an unwelcome result
Findings usually fall into three buckets, in increasing order of cost:
- Behavioural. Dock doors held open, HVAC set back overnight, hold steps in unconditioned corridors. Cheapest to fix, often the largest single contributor.
- Packaging. Size the desiccant against the 95th percentile rather than the design set-point. Predictable cost, immediate effect.
- Facility. Dehumidification capacity or envelope work. Expensive, slow, and sometimes unavoidable — but the mapping data is what justifies the capital request.
Where the product is genuinely sensitive and the room cannot be fixed quickly, the package carries the load in the interim. That is a legitimate use of packaging, provided it is a documented decision rather than an accident.

Frequently asked questions
How many sensors does a warehouse mapping study need?
Enough to characterise the variation, which depends on volume, rack height, number of doors and HVAC zoning. The test is whether adding another sensor would change the reported distribution. If you do not know, you do not have enough.
Can we use the building management system instead of loggers?
BMS sensors are usually mounted for control, not for product exposure — wall-mounted, in the return air path, at eye height. They are useful context and a poor substitute for a mapping study.
Do we need to repeat this every year?
Repeat after any change to HVAC, building envelope, layout, throughput or product mix. Otherwise a periodic verification campaign is usually proportionate.
What if the fill room turns out to be the problem?
Then you have found the highest-leverage fix available, because every point of excess RH at seal is load the package carries for its whole life. The layer model is in room, process or package.
Does this apply to distribution and 3PL sites too?
Yes, and it is the same argument — with the added difficulty that you may not control the site. See desiccant for Amazon FBA and 3PL inventory.
Turn your mapping data into a dosage
Send the 95th-percentile RH for your fill room and warehouse plus your pack details. ATMOSIScience will size the desiccant against real conditions, not a set-point.
Prefer email? info@atmosiscience.com